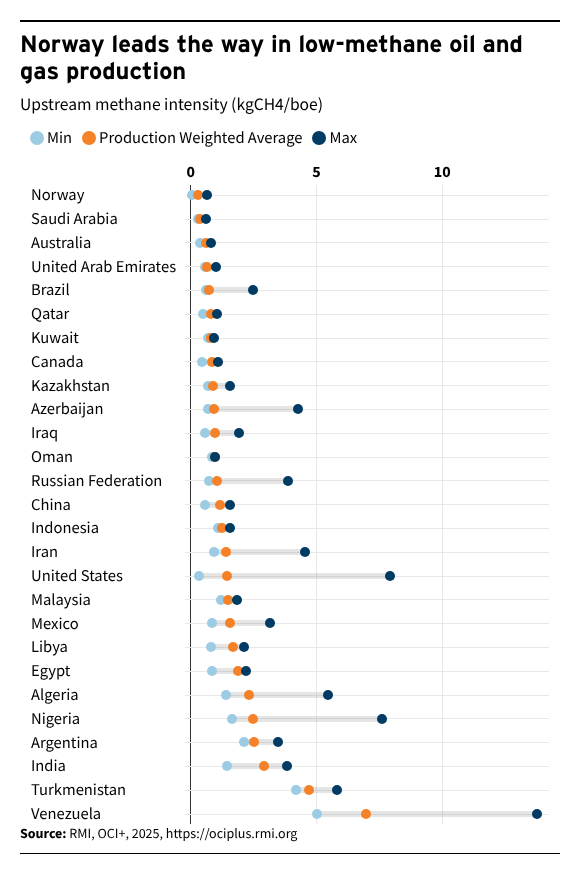
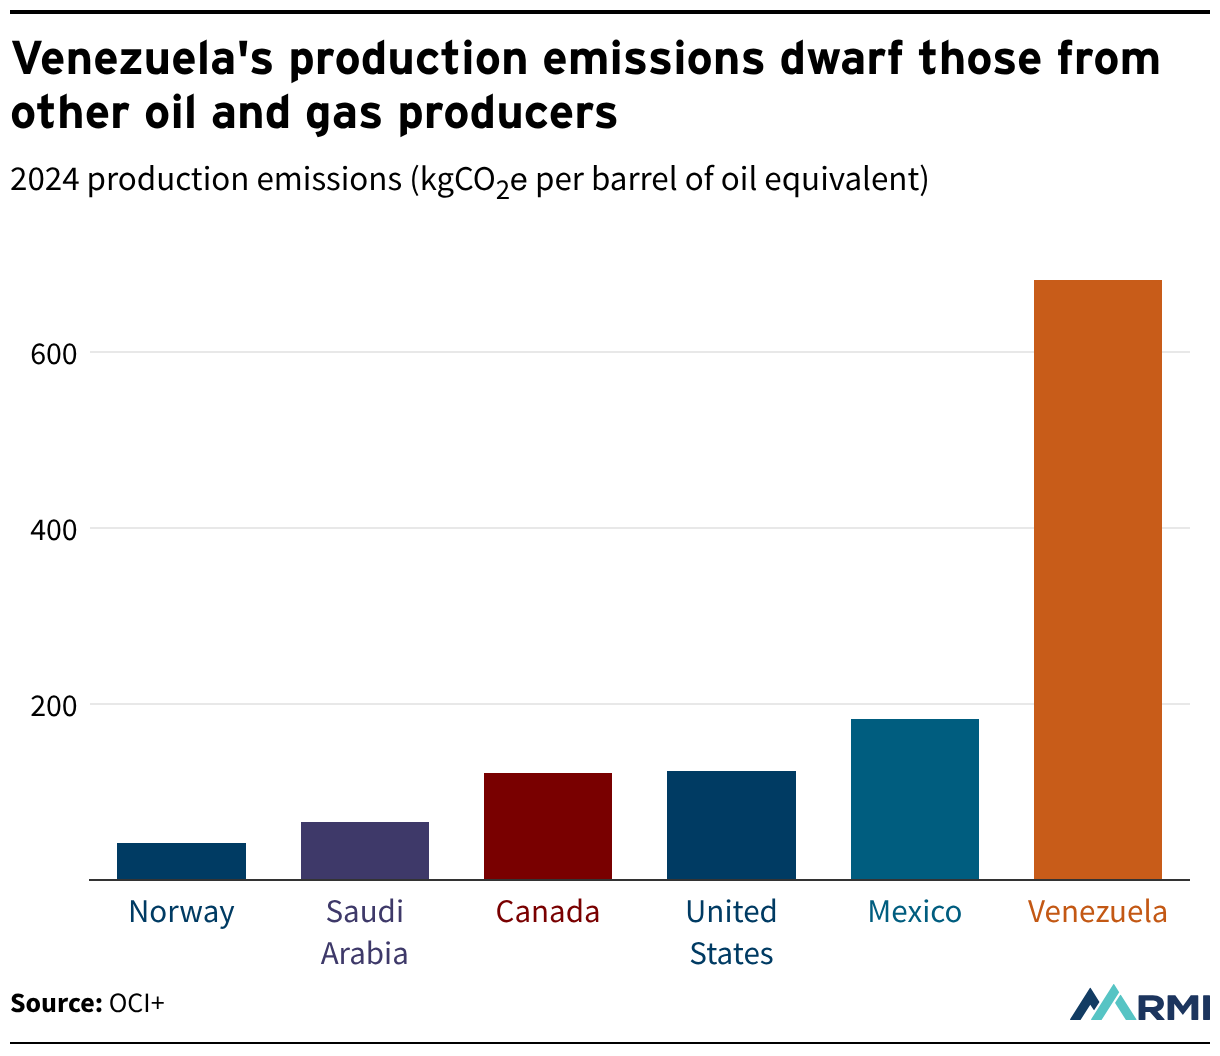
SPARK CHART
Islands

As Islands Grapple with Spiking Fuel Costs, Renewables Offer a More Secure and Affordable Option
May 18, 2026
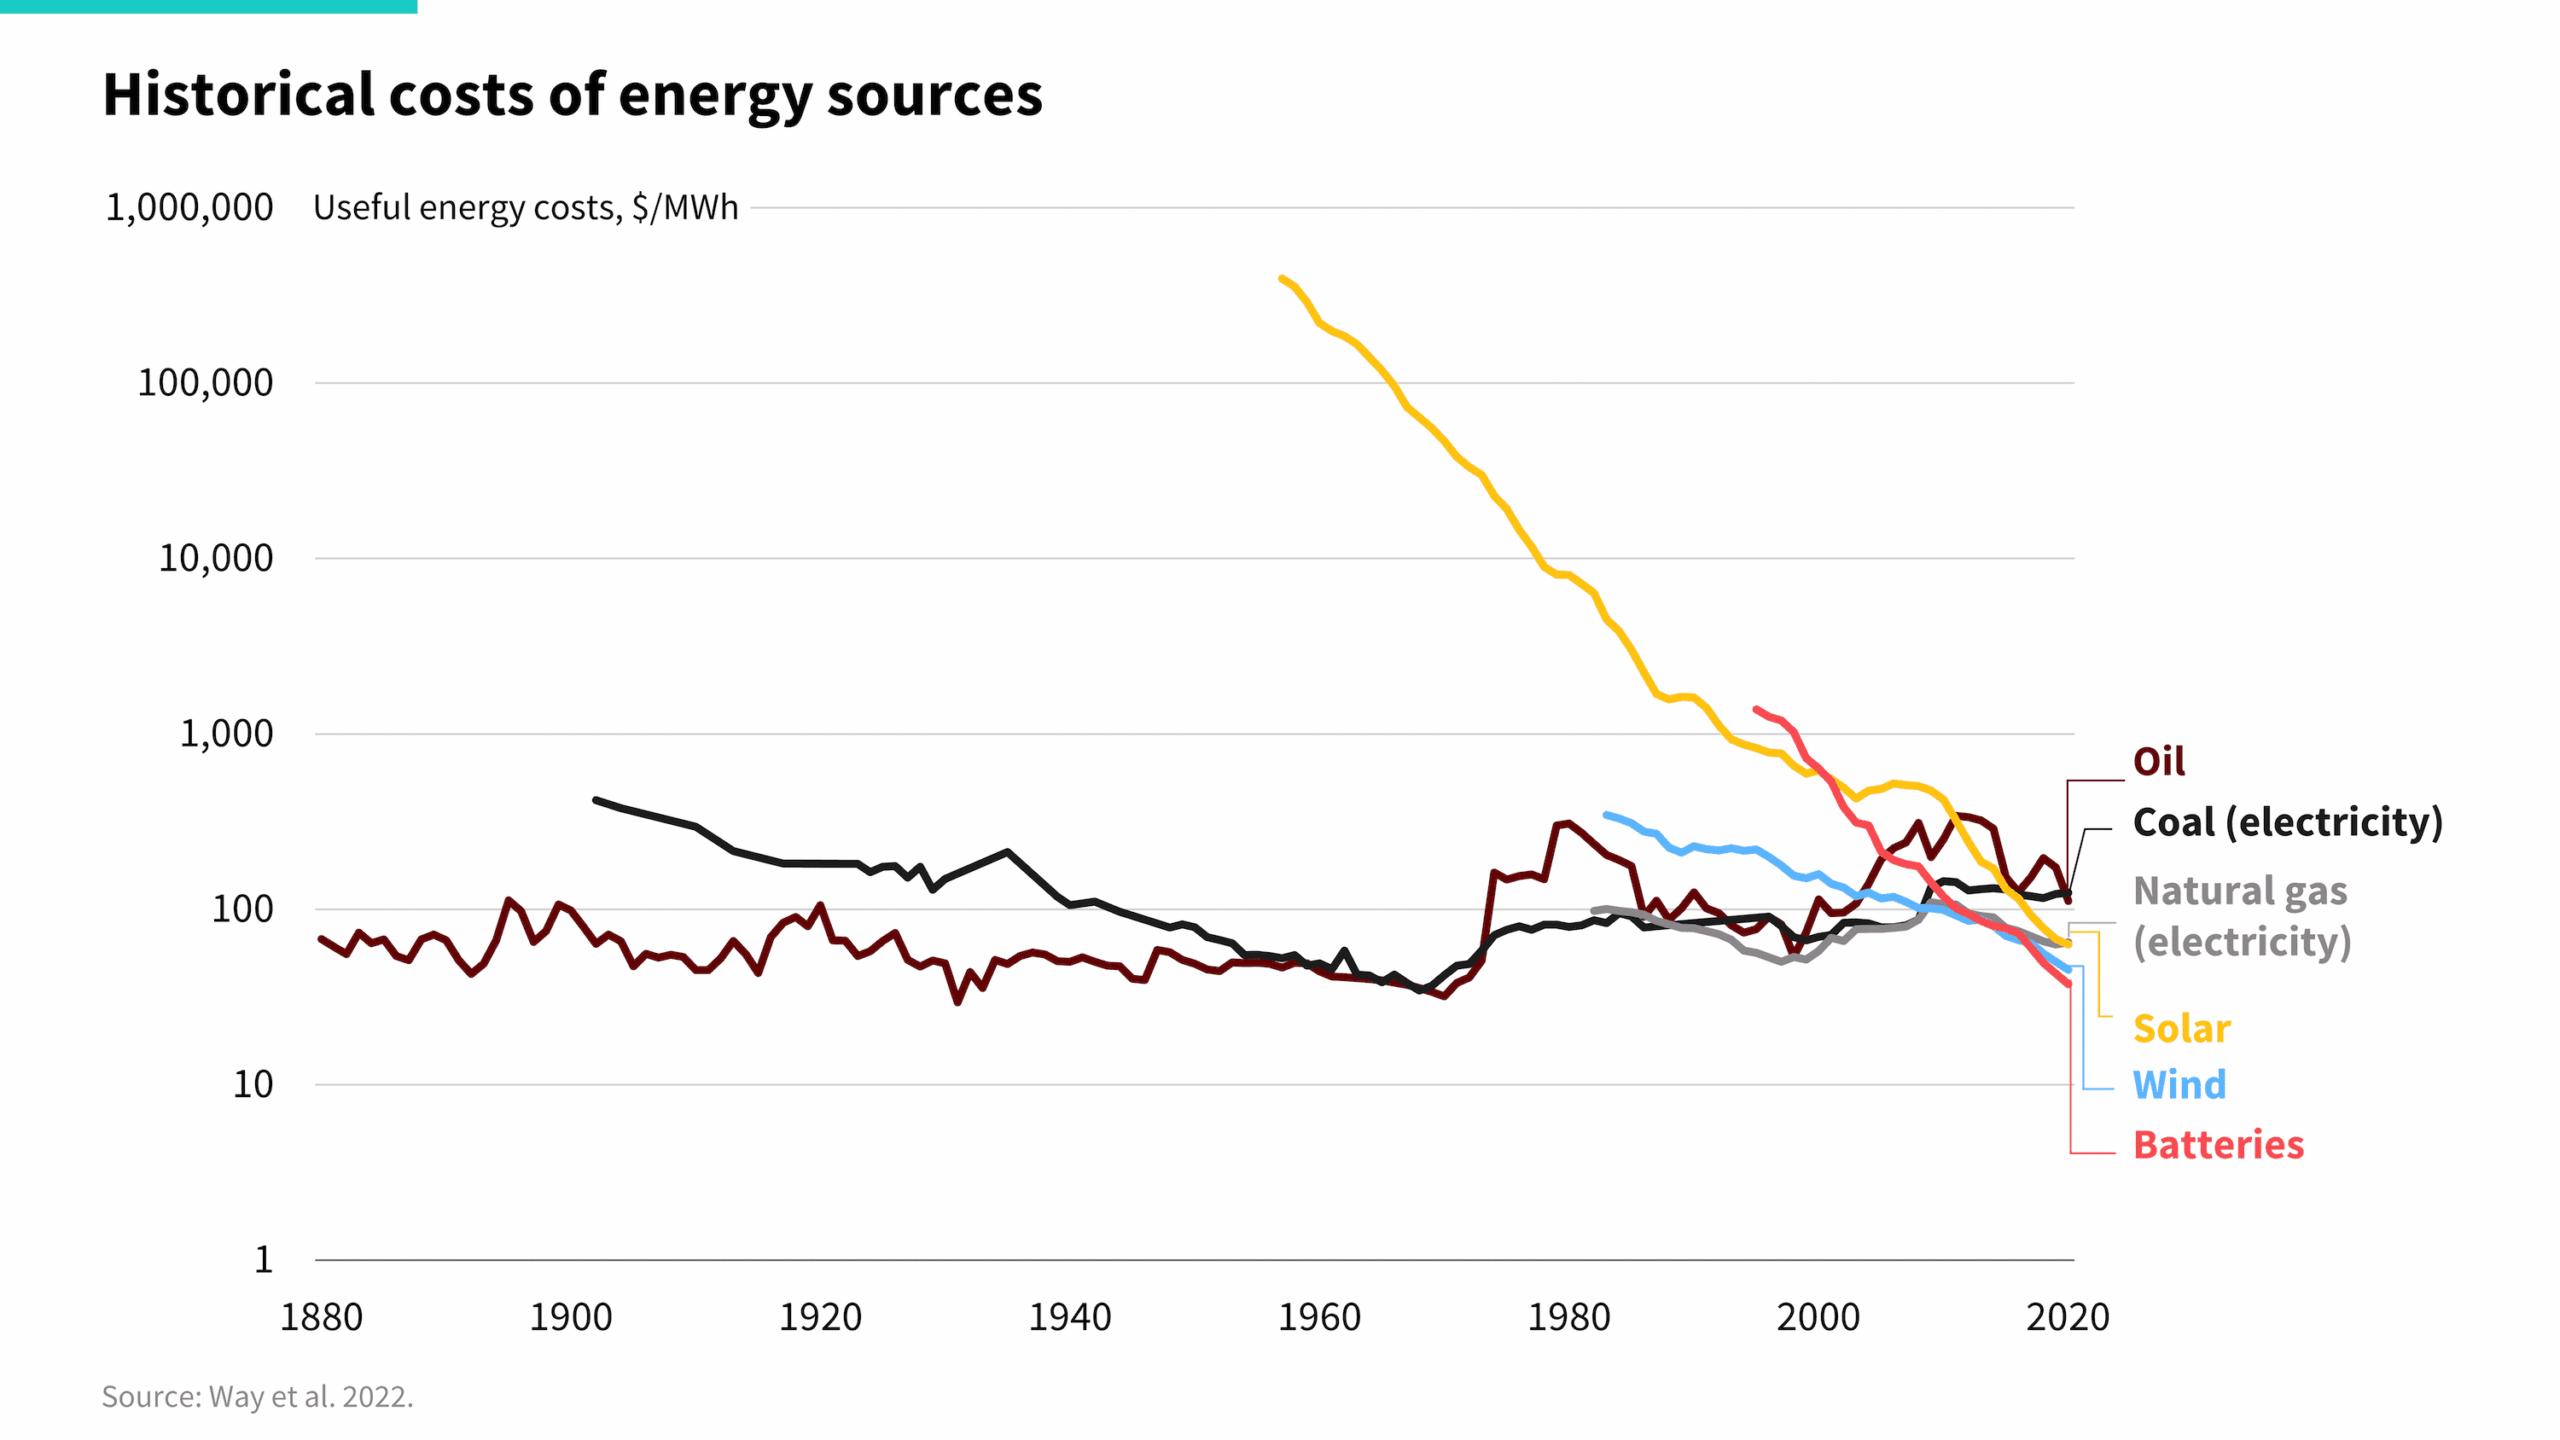
According to the EIA's latest Energy Outlook, island fuel oil costs spiked 33% in one year. However, solar, wind, and geothermal costs remained low and continue to fall.