
Hydrogen Under 45V: Analyzing Electricity Availability Under Proposed Rules for the Hydrogen Tax Credit
A perspective of regional hydrogen production potential from near-term, credit-qualifying Energy Attribute Certificate (EAC) availability.
In order to stem centuries of pollution and move toward a future of clean energy, we need to pursue every tool at our disposal, from new technology to efficiency to ready-to-go renewables. Some industries — such as steel and clean fuels— cannot be electrified easily and will need another —non-polluting — way to operate. Green hydrogen, which requires clean electricity and water, is a key solution. One important challenge on the pathway for green hydrogen is proving that the electricity consumed is in fact clean.
Like any nascent technology, the hydrogen market is still finding its feet — and production costs remain high. Tax credits like those issued under the Inflation Reduction Act (IRA) are designed to drive down those costs and jumpstart the industry. The Clean Hydrogen Production tax credit, otherwise known as 45V, has the potential to provide this much-needed industry boost, but first we need to know how it can be applied. This piece builds on past RMI work, assessing tradeoffs in the design of the regulations, and moves toward an initial evaluation of their impact and articulation of needed actions to ensure they meet the dual objectives of supporting market liftoff while ensuring environmental integrity.
In December 2023, the Treasury Department issued proposed guidance on the IRA’s Clean Hydrogen Production Tax Credit. The proposed guidance conditions eligibility for the credit — a 10-year incentive of up to $3 per kilogram of hydrogen produced — on the verified use of clean power that is new, nearby, and hourly matched. We break down each of those terms below.
- Power must come from carbon-free electricity facilities placed into service up to 36 months before the commencement of the hydrogen project, to ensure that new clean energy capacity meets or exceeds the energy intensity of hydrogen production.
- Nearby — and deliverable. Power must come from the same Transmission Needs Region, to ensure that clean electricity generated for hydrogen production can physically “reach” the production facilities.
- Hourly matched — by 2028. The hourly matching requirement means that hydrogen producers may only claim zero-carbon power if the amount of clean electricity needed during that hour is generated within that same hour.
These rules, known as the “three pillars,” aim to ensure that the electrolytic (also known as green) hydrogen industry scales in a climate-friendly and grid-friendly manner. The release of the proposed rules in December provided industry actors and other stakeholders with clarity on the definition of clean hydrogen and added specificity regarding how a project must be designed and operated.
Here, we analyze these rules in the context of the seven Regional Clean Hydrogen Hubs (H2Hubs). These hubs are part of a larger national effort to develop a clean hydrogen market that will enable the decarbonization of various sectors of our economy, particularly those that cannot rely on direct electrification. Our analysis quantifies the availability of Energy Attribute Certificates (EACs) — the relevant documentation system for clean power use — to determine whether there will be enough available 45V-qualifying electricity to meet each hub’s stated electrolytic hydrogen production goal.
Our preliminary finding: There are enough projected tax credit-qualifying EACs available to meet the stated electrolytic hydrogen production goals across Regional Clean Hydrogen Hubs. However, the system of markets and contracts required to access EACs is underdeveloped, and this is a critical challenge to both market formation and the effective operation of the tax credit.
Some caveats: within our analysis, system and contractual maturity were not considered, competing demand of EACs from existing and emerging buyers was not accounted for, nor was the potential impact of delays associated with available infrastructure assessed. These pieces are critical to frame the analysis fully and to realize the full potential of a functioning and liquid EAC market. The Department of Energy(DOE) and other bodies with oversight must be sure to consider these impacts and consider the holistic sets of steps needed to activate the market for time-matched electricity or EAC sales. Failure to address these challenges creates a greater need for flexibility in electrolysis operation and a considered approach to issues such as grandfathering, which, while not the first option of preference can enable early market engagement and a bridge toward a fully three-pillar compliant market.
Challenges Facing the Market
With further clarity on the requirements for accessing the 45V tax credit, electrolytic hydrogen developers are now re-evaluating their approach to project designs and investment strategies. They’re considering how energy storage and renewable power procurement will shape their production potential, and confronting persistent uncertainties related to power grid constraints, product standards, and potential monetization models. Ensuring that project designs enable hydrogen production at or below a buyer’s willingness to pay is a key consideration for first movers securing offtake contracts.
The challenges project developers continue to face should be taken seriously and will need to be overcome for the nascent US electrolytic hydrogen market to rapidly and successfully scale up. We do not anticipate, however, that the near-term availability of Energy Attribute Certificates (EACs) will be among the challenges stalling the buildout of green hydrogen projects. Our analysis in the following sections explains why.
EAC Availability Analysis
Model Approach
This analysis evaluates the credit-qualifying electrolytic hydrogen production possible in each hub region given the availability of regional Energy Attribute Certificates (EACs) compliant with the “three pillars.” It is not an assessment of the feasibility of hydrogen production at each hub, but rather an evaluation of the depth of attribute availability for hydrogen production aligned with the Notice of Proposed Rulemaking (NPRM).
Methodology for Total Availability Calculations
The analysis provides a perspective of how much electrolytic hydrogen production could be supported within a hub region through use of credit-qualifying electricity generation that may become available by 2030 and over the course of the tax credit period for a project coming online now. Our methodology demonstrates one pathway among many in evaluating attribute availability from the 45V tax credit.
These standards are administrable and predictable — capacity expansion modeling can quantify how many attributes are available for each hub. Expected net available electricity generation across hub regions was sourced using data from the National Renewable Energy Laboratory (NREL) Regional Energy Deployment System (ReEDs) capacity expansion model “[Inflation Reduction Act]-[Bipartisan Infrastructure Law] Mid case” scenario, which “represents the power system evolution that would occur if all economically optimal investment and retirement opportunities were executed.” We pulled their estimations of regional electricity capacity growth from 2024–2035 and isolated out the renewable energy projects that meet the incrementality requirements under 45V across wind, solar, nuclear, hydro, and geothermal sources. The use of electricity storage was not considered in this analysis given limited Treasury guidance on if and how the resources will be considered compliant.
To identify net electricity generation available for hydrogen production, we subtracted each state’s current electricity consumption from the hourly generation dispatch profile to identify the available amount of total electricity generation for hydrogen production, referencing data from the NREL’s Cambium 2022 dataset. If the additional electricity is generated from renewable sources, it is considered to qualify as an EAC. These results were compiled across the 13 electricity deliverability regions in the United States to evaluate regional EAC availability.
We then used the total region-by-region EAC availability to estimate the corresponding total potential of supported electrolytic hydrogen production capacity. To note, this assessment assumes that all available EACs can be allocated toward hydrogen production throughout the period assessed.
Optimizing Electrolyzer Fleet
To calculate hydrogen production potential, we first baselined the electrolyzer capacity if electrolyzers consumed 50 percent of all available EACs. We then refined the assessment to attempt to maximize total electrolyzer capacity, minimize curtailment of eligible EACs, and result in reasonable capacity factors for electrolyzer utilization. If EAC availability was present in the region to support further hydrogen production, more electrolyzer capacity would be added. The upper bound of the fleet electrolyzer utilization was set to 80 percent; and if utilization exceeded 80 percent, the model would add marginally more electrolyzer capacity until the target of 80 percent was converged to.
The results provide an approximation of total electrolyzer deployment, the electrolyzer fleet’s capacity factor, total hydrogen production, and “curtailed attributes” from eligible generation that lacked sufficient electrolyzer demand during peak production hours, all while assuming that all eligible attributes are assigned to hydrogen production.
Model Limitations and Future Directions
As noted in the introduction, this modeling approach does not account for EAC market competition and hence any conclusions about attribute availability assume complete procurement ease and static pricing. These are assumptions that do not reflect the real market conditions but allow us to quantify the delivery needs for new renewables and illustrate the case for a higher functioning and liquid traded market. In addition, we have not accounted for transmission and interconnection needs, which are a significant challenge facing all energy markets — this further illustrates the need for holistic and immediate action to enable hydrogen project development as well as broader renewable energy deployment. Importantly, this analysis does not assess hydrogen production costs resultant from production using available EACs; this is a central consideration for a region’s near-term hydrogen supply potential. In addition, below is a list of other areas of constraint within the analysis and further details of a few critical implementation challenges.
This analysis does not include additional pathways for hydrogen production found through:
- Use of energy storage to time shift EACs (increasing capacity factor)
- Pre-existing demand for EACs and the potential for significant future competition in the target timeframe
- Integration of “curtailed” power from existing resources (increasing EAC availability)
- Interregional or international electricity wheeling (increasing capacity factor balancing across regions)
- Evaluation of mismatches in the pace of electrolyzer deployment with the pace of clean power deployment which could cause dynamic market impacts over the credit period
There are several ways to improve the findings of this analysis through:
- Cost analysis of EACs to understand the market dynamics of increased demand
- Competitive dynamics with other EAC consumers
- How state level policy interacts with EAC availability
- Additional capacity expansion modeling and further sensitivity analysis
- Analysis that includes capacity impacts of increased hydrogen demand (see: EPRI)
Model Results
Our analysis produced two perspectives on qualifying three-pillar electricity and corresponding hydrogen production across the various deliverability regions. First, we provide a perspective of near-term hydrogen production potential considering compliant EAC availability between 2024 to 2030. We find that there are enough qualifying EACs available to meet the stated electrolytic hydrogen production goals across each of the Regional Clean Hydrogen Hubs, as seen in Table 1.
Regions like the Plains and Midwest have the potential to support significantly higher levels of hydrogen production than currently proposed by hubs, while other regions like the Northwest have more limited qualifying electricity and may see heightened challenges for competing demand for EACs across hydrogen production and other loads.
Additionally, we extended the timeframe of the analysis to 2035, representative of the duration of 45V credit-qualification for a project coming online within the year. If all forecasted eligible clean attributes were directed toward hydrogen production during this period, this could yield an approximate average 24 million metric tons (MMT) of hydrogen production per year across a total of ~210 gigawatt (GW) of electrolyzers operational by 2035, as seen in Table 2. Across regions, just below 30 percent of qualifying EACs remain not utilized to produce these volumes of hydrogen, indicating that additional hydrogen production could be supported through inclusion of electricity storage. These EACs could also be used to support other operations that require hourly renewable electricity supply.
Stress testing EAC availability based on different assumptions:
Two major external influences could drive this market depth up or down:
- Competing demand for hourly EACs: Total US datacenter demand for electricity is projected to grow from 17 GW to up to 35 GW by 2030. Assuming the entire fleet of datacenters requires hourly EACs and aims for a similar capacity factor to hydrogen, the overall “market depth” of EACs available to hydrogen producers would decrease. Competition for EACs could place limits on the overall capacity factor of electrolyzers, especially if regions of hydrogen production and datacenter placement overlap. As such, adding perspective of full demand markets into the analysis will create demand pressures and drive pricing for EACs higher. This sensitivity around pricing is outside the scope of this initial high-level screening but should be the focus of future work.
- Grid response to hydrogen demand: The Cambium mid-case scenario does not calculate the impact of hydrogen loads on overall clean electricity production forecasts, and thus does not consider additional renewable energy development in response to increased electricity demand for hydrogen production. This is both a major simplification, but could be a conservative estimate on the aggregate availability of incremental clean power for electrolysis. However, increasing power demand beyond project supply also could drive higher prices. New load will likely be filled, in part or in full, by additional clean capacity beyond the mid-case scenario. The availability of attributes for built electrolyzers will likely immediately exceed the Cambium projections, but the physical barriers (e.g., interconnection, grid upgrades, sufficient net new power capacity, and timelines for new project approval) for individual project development will likely be the bottleneck, rather than a lack of qualifying EACs.
What More Is Required
Each hub is indicated to have enough available attributes to meet their early stated production goals for electrolytic hydrogen production. However, acquiring these attributes in practice for hydrogen projects will require coordination between developers, utilities, and registries over the next five years. Developers have several strategies available to contract for these attributes of varying complexity levels. Given hydrogen is one of the earliest loads that value hourly matching for compliance (due to the nature of the 45V lifecycle structure), hydrogen producers could be “first in line” for hourly attributes as new capacity comes online.
Overall, the fundamentals — the availability of incremental, deliverable, hourly matched clean power — are likely to be available. But an early bottleneck will be developing the markets and the data infrastructure required to get the associated attributes into the hands of hydrogen developers. Project developers need the data infrastructure and contracts to predictably acquire these attributes for the hourly EAC market to develop. This analysis suggests there is significant economic opportunity for players able to bridge this gap rapidly. Addressing these barriers to acquiring attributes and growing competition will incentivize additional clean capacity and increased competition, helping to drive real emissions reductions.
Unlocking this Potential
To unlock these attributes, three capabilities are necessary:
- Registries: Early on, registries will likely need to ensure that the volumetric attributes are only retired once, while using hourly meter data to prove hourly matching to Treasury. More hourly-specific features will be available over time, expanding tradability, but the simplest version enabling bilateral contracts should work with most existing registries with no major adjustments.
- Contracts: Clean power producers and hydrogen producers will need to contract for hourly EACs over a longer period. Identifying terms, data sharing, and accuracy will be critical.
- Real-time data sharing: To ensure balanced generation and consumption, the generator will need to share real-time production data along with forecasts to enable appropriate electrolyzer ramping.
Each step has several working examples to demonstrate how this could be implemented in practice — scaling these concepts and systems for hydrogen producers is a core goal of RMI, with the anticipated milestone of developing bankable data and compliance strategies within the year.
The final bottlenecks
The three pillars are non-discriminatory to new clean capacity types, reward balanced regional development, and guard against scenarios where hydrogen production increases net emissions throughout the credit period. While this analysis diverts all projected all clean power to hydrogen production that could be used to decarbonize the grid, each attribute considered would be valid for use in 45V in accordance with the rules established by the NPRM.
Hubs and hydrogen projects face other challenges to economic deployment — achieving higher capacity factors, negotiating low-cost rates that value flexibility, and buildout of multi-day hydrogen storage to ensure steady offtake all add costs to project development. EAC price and availability are but one variable of many when optimizing hydrogen projects.
Ultimately the primary barriers to the green hydrogen economy are not primarily accounting issues, but the traditional physical bottlenecks to clean energy deployment in the real world — siting and permitting, interconnection, regional transmission, and large project management. These delays drive up the cost of electricity and in kind make hydrogen projects less economically viable. In other words, efficiently building new capacity to serve new load is likely to be the fundamental bottleneck — not accounting.
Appendix
Table 2B. Summary of relevant outcomes for each deliverability region (same as Table 2 above), for 2024-2030:
Supporting Figures: Hourly Heatmaps of EAC Availability by Region (2024-2030)
The figures below depict a collection of heatmaps that visualize the hourly distribution of available EACs across several US deliverability regions. The x-axis represents the hour of the day, with midnight EAC availability starting on the left through to EAC availability at 11:59 p.m. on the right. The y-axis represents the month of the year, with availability in January starting at the top of the graph through to EAC availability in December at the bottom. Hours with high EAC availability are represented by yellow and green shades, while hours will low hourly EAC availability will be orange and red.
Regions with high EAC variability will have distinct “highlights” in the middle of the day due to higher availability of solar energy relative to other forms of renewable energy, as can be seen in the Northwest region. Regions with more complementary renewable energy projects will have a more even distribution of EAC availability throughout the year, such as in the Texas region.
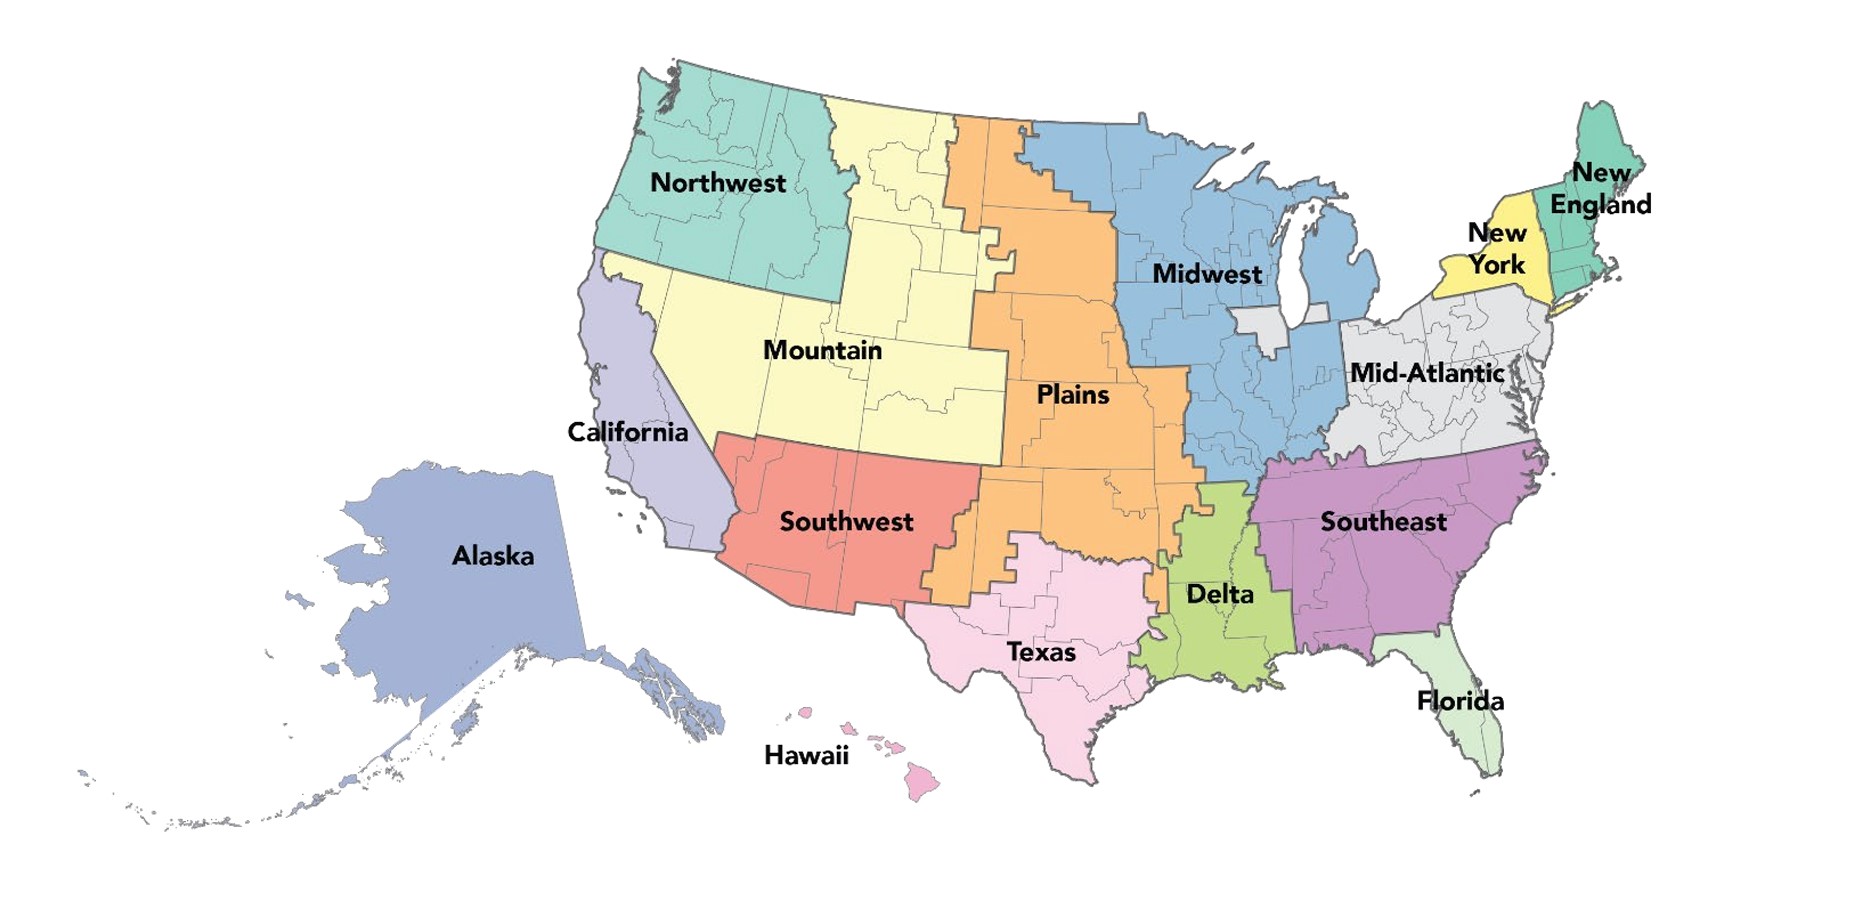
Source: National Transmission Needs Study 2023 (DOE)
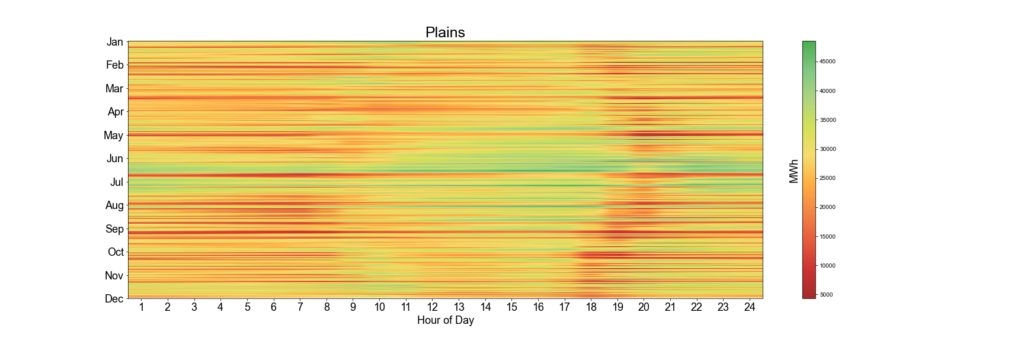
The Plains region demonstrates balanced availability across hours and seasons, with some pockets of low hours. This is driven primarily by solar and wind availability in that region.
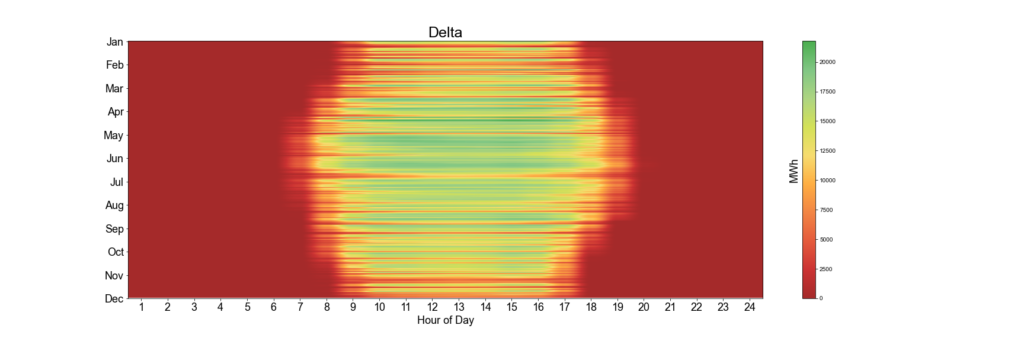
The Delta region projects the only new clean resource is solar – as a result, the absence of other balancing resources creates a profile where EAC availability in the nights and winter are scarce. Wind buildout could help balance EAC availability in this region, despite having mid-tier quality resources available.
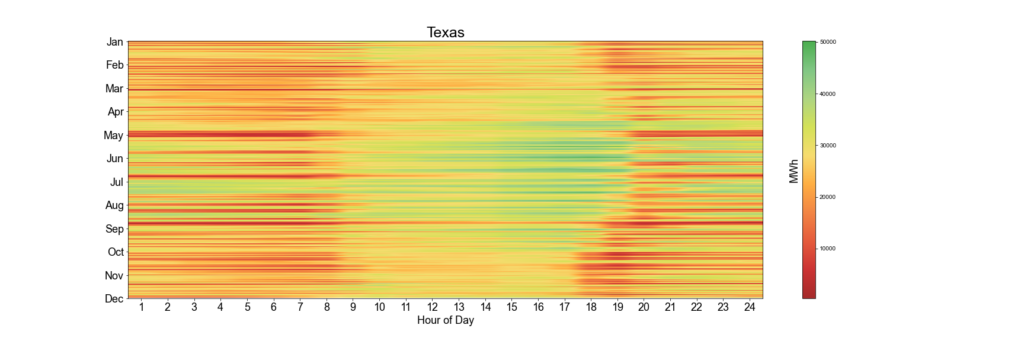
Texas demonstrates the fingerprints of a strong midday solar resource, but due to the quality of wind resources, boasts significant availability of EACs in the nights and winters. Several multi-week lulls, indicated by red horizontal bars, show the need for flexibility or hydrogen storage to create a firm hydrogen resource. Note that the axis peaks at around 40 GWs in certain hours, demonstrating a significant influx of incremental clean resources.
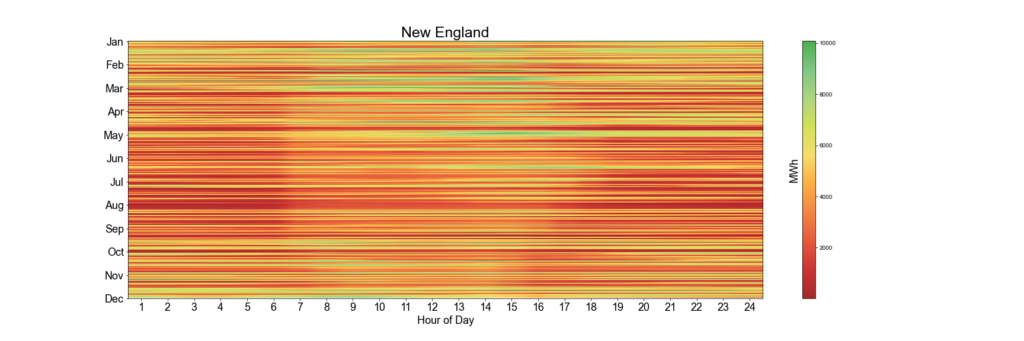
New England has fairly distributed resources with more periods of low availability in August and April. The solar resources are slightly visible. Clean firm resources or an expansion of wind, solar, and storage, could help bridge these gaps. There is some seasonal consistency, but the diurnal firming remains a challenge.