Learn how we are working to transform how we use and produce energy.
The Economics of Clean Energy Portfolios
Why we share this work for free
RMI is an independent nonprofit working to accelerate the clean energy transition. We publish research like this to inform decision-makers and drive real-world impact.
Our work is supported by philanthropy as well as partnerships, including fee-for-service engagements. This support makes it possible for us to share our independent insights for free.
If you find this work valuable, you can support it anytime.
Get more insights like this
Stay up to date with the latest research, analysis, and tools from RMI by opting in to receive occasional emails below. You’ll get new reports, event invitations, and practical insights to help us all accelerate the clean energy transition.
Loading form...
Your download should start automatically. If it doesn’t, click the download button below.
This work is made possible by philanthropy
RMI is a nonprofit supported by donors and partners. Philanthropy enables us to produce independent research and make resources like this freely available.
If you find this report valuable, please consider supporting our work. You can also explore how we partner with organizations to drive impact.
Jump to Section
The US power system is one of the largest, most complicated, and most expensive machines in the world, but the grid’s core infrastructure is old and is not aging gracefully. Nearly 500 gigawatts (GW), or about half of the existing thermal generator fleet (i.e., coal-, nuclear-, and gas-fired power plants) is likely to retire by 2030, leading to a gap in capacity that will need to be addressed with new investment.
US electricity generators may be committing their customers and investors to as much as $1 trillion in future investment and fuel costs through 2030 as they rush to build new gas-fired power plants. Yet advances in renewable energy and distributed energy resources (DERs) offer lower rates and emissions-free energy while delivering all the grid reliability services that new power plants can, according to RMI’s The Economics of Clean Energy Portfolios report.
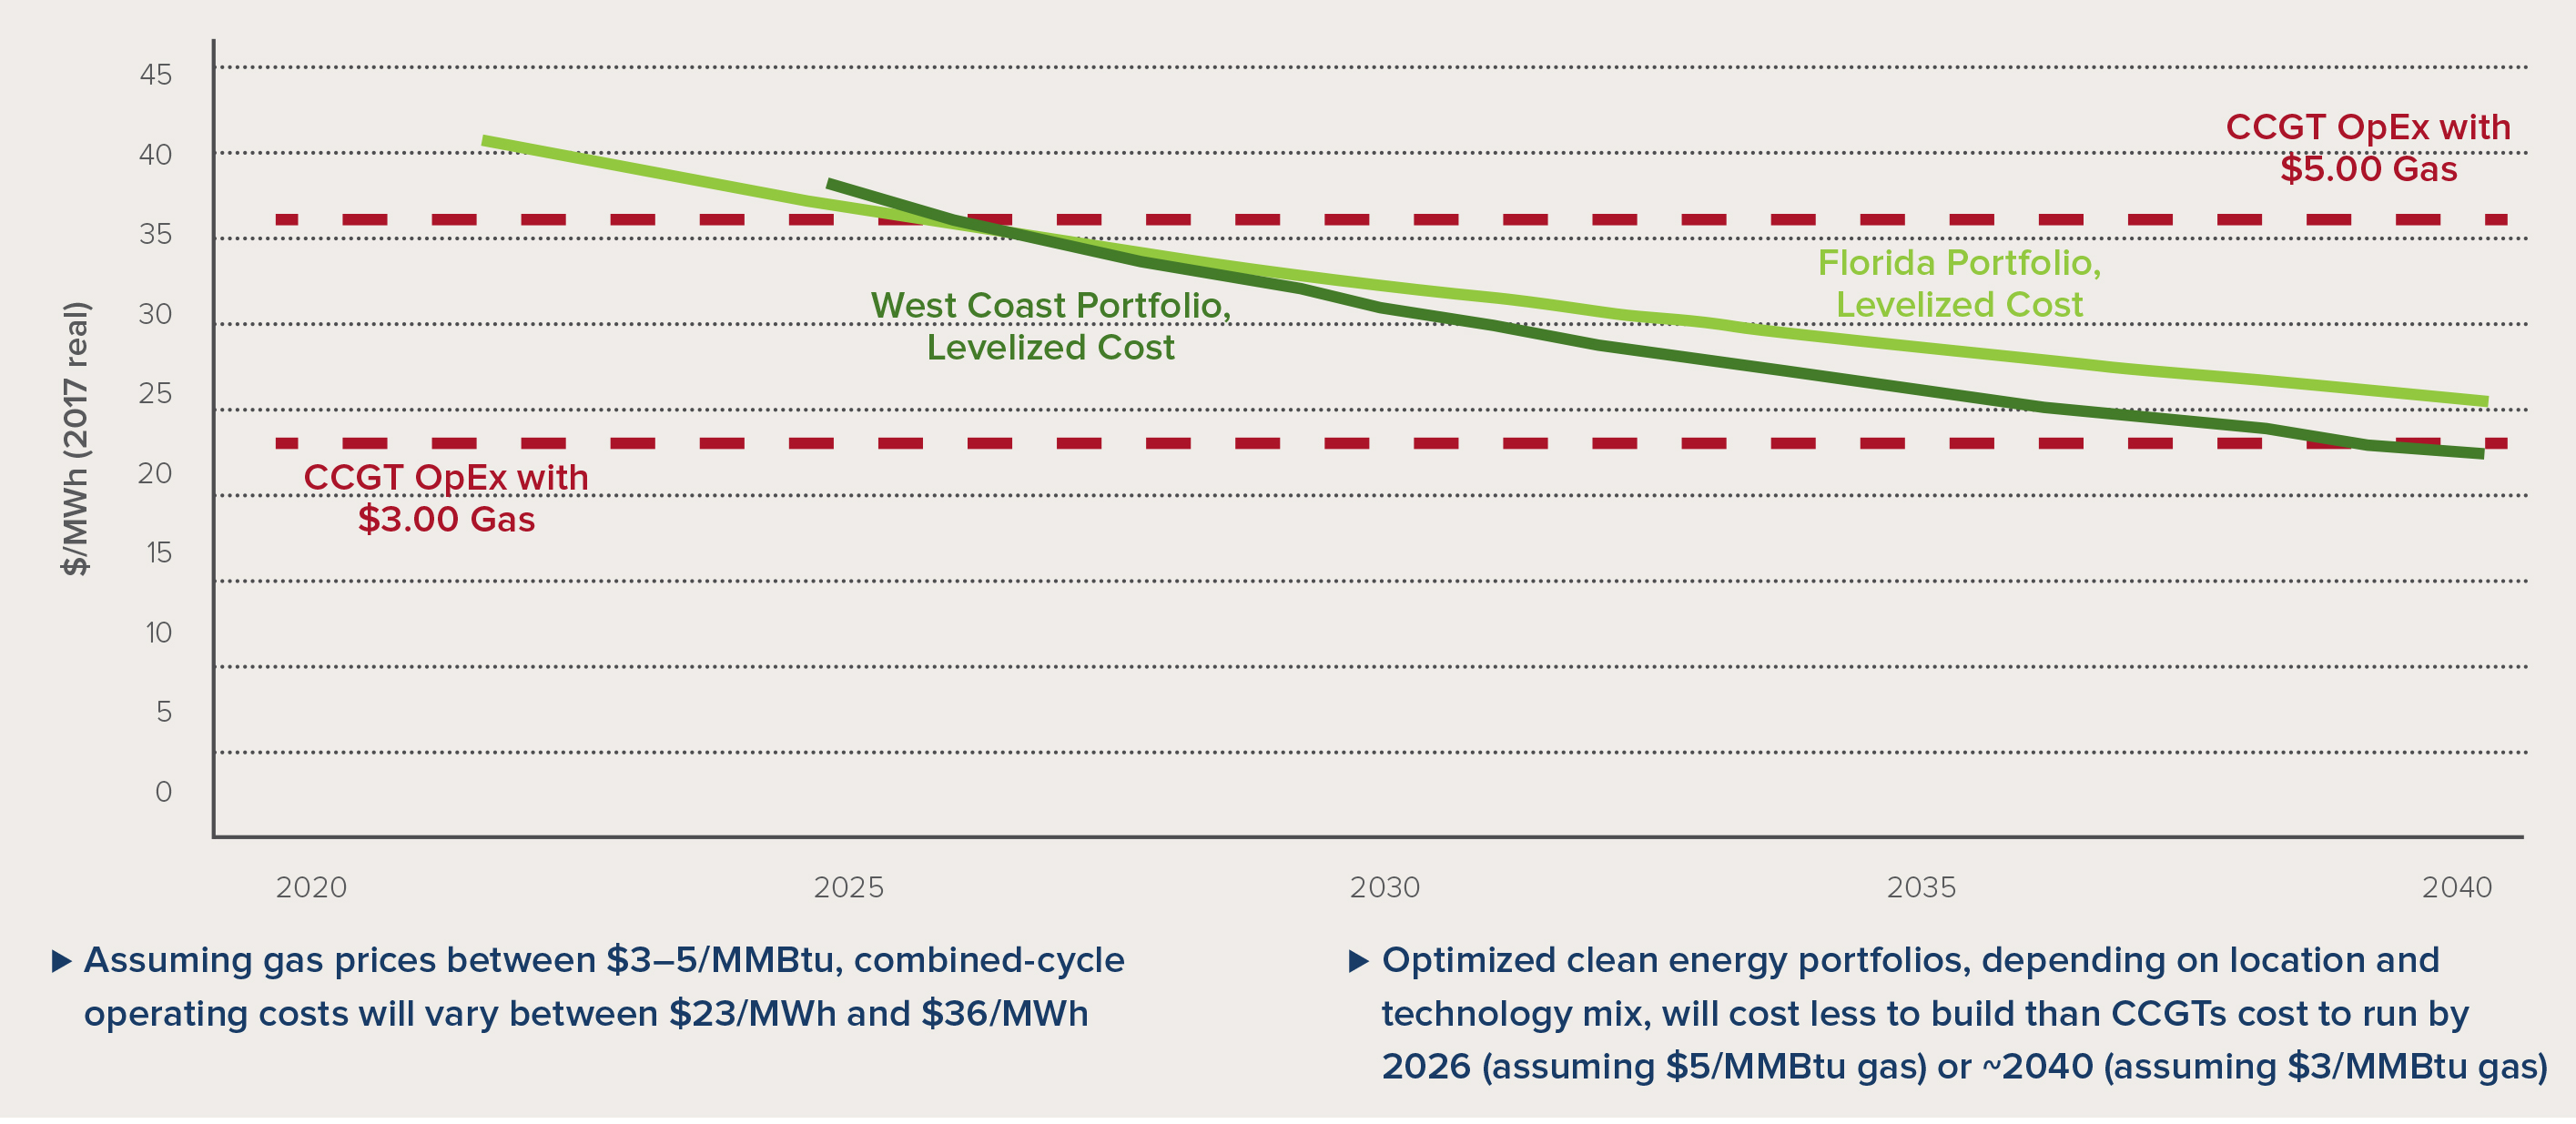
RMI’s analysis finds that, because of recent innovation and rapid cost declines in renewable energy and DER technologies, clean energy portfolios can often be procured at significant net cost savings, with lower risk and zero carbon and air emissions, compared to building a new gas plant. More dramatically, the new-build costs of clean energy portfolios are falling quickly, and likely to beat just the operating costs of efficient gas-fired power plants within the next two decades—a sobering risk for investors and customers in a market with over $100 billion of already announced investment in new gas-fired power plants.
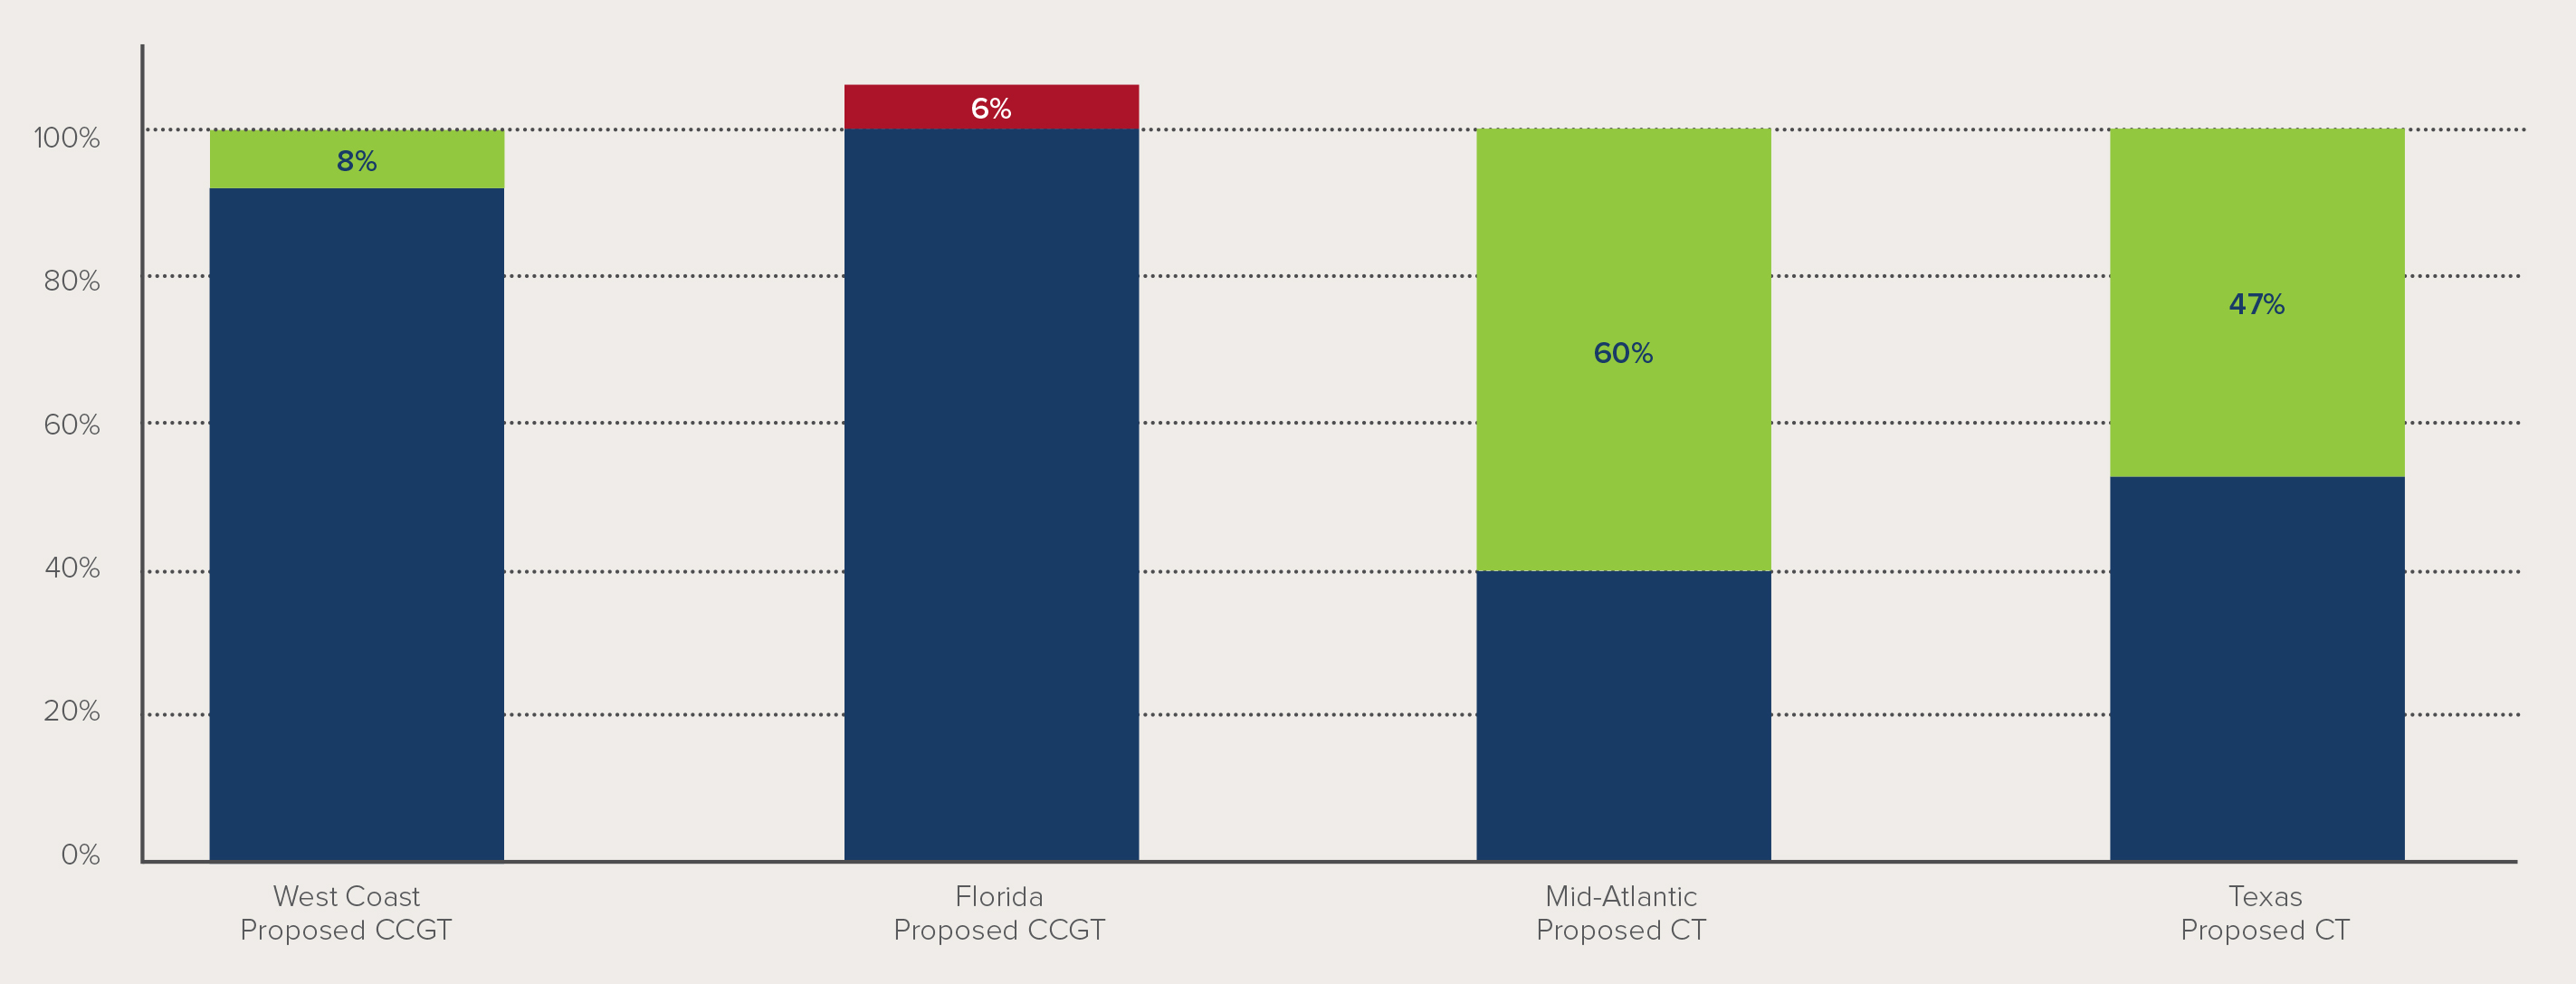
The report analyzes four natural gas-fired power plants currently proposed for construction across the US and compares them with optimized, region-specific clean portfolios of renewable energy and DERs that can provide the same services. The analysis includes two announced combined-cycle gas turbine power plants, planned for high capacity-factor operation, and two announced combustion-turbine power plants, planned for peak-hour operation. In three of the four cases, an optimized clean energy portfolio would cost 8–60 percent less than the announced power plant. In only one case the analysis finds the net cost of the optimized clean energy portfolio is slightly (~6 percent) greater than the proposed power plant. Factoring in expected further cost reductions in distributed solar and/or a $7.50/ton price on CO2 emissions, all four cases show that an optimized clean energy portfolio is more cost-effective and lower in risk than the proposed gas plant.
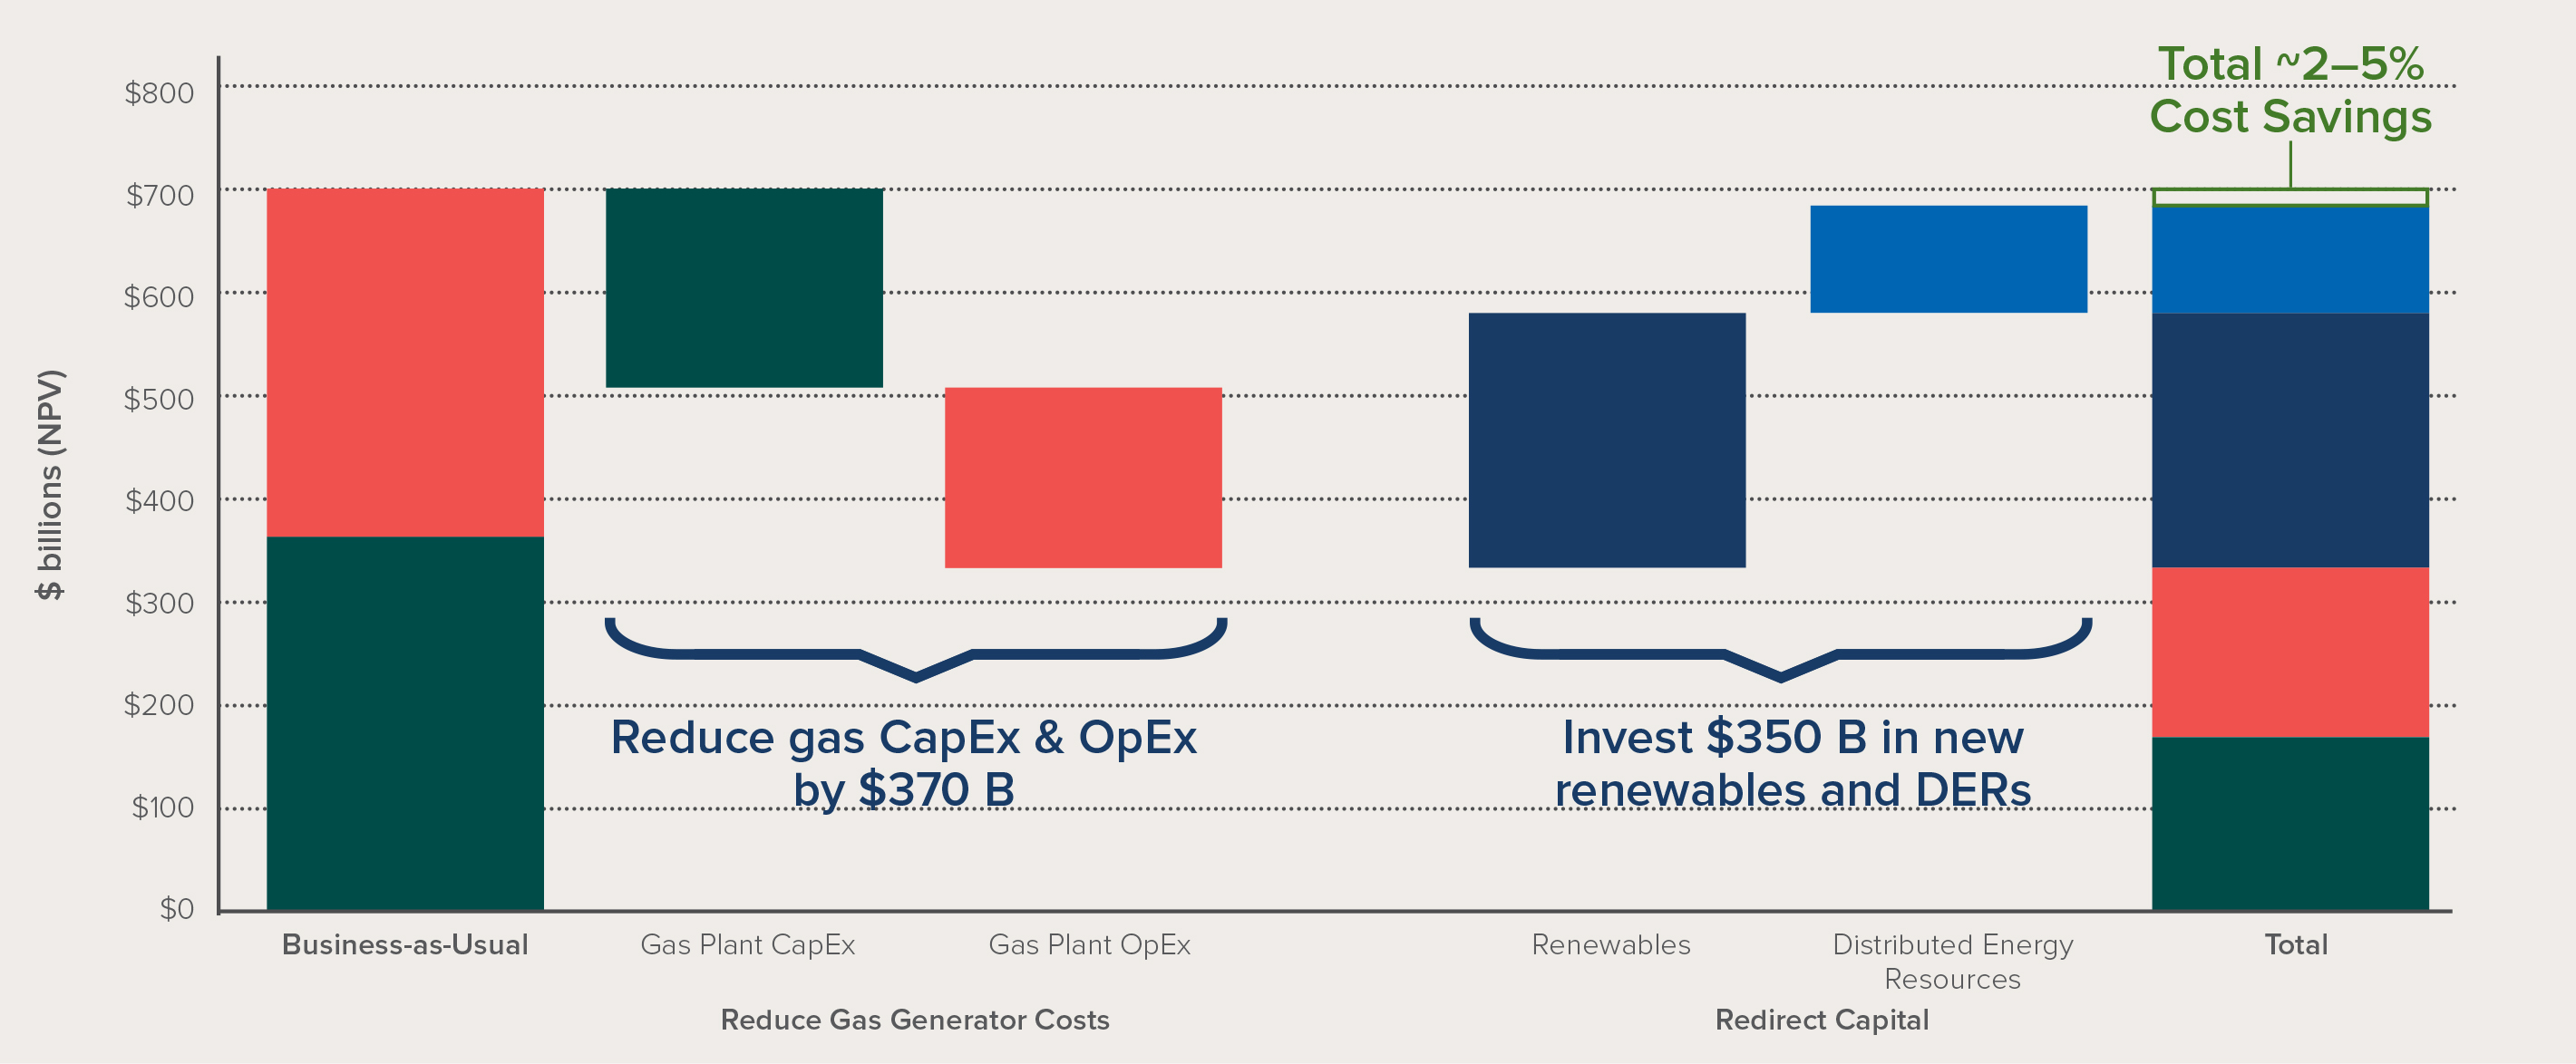
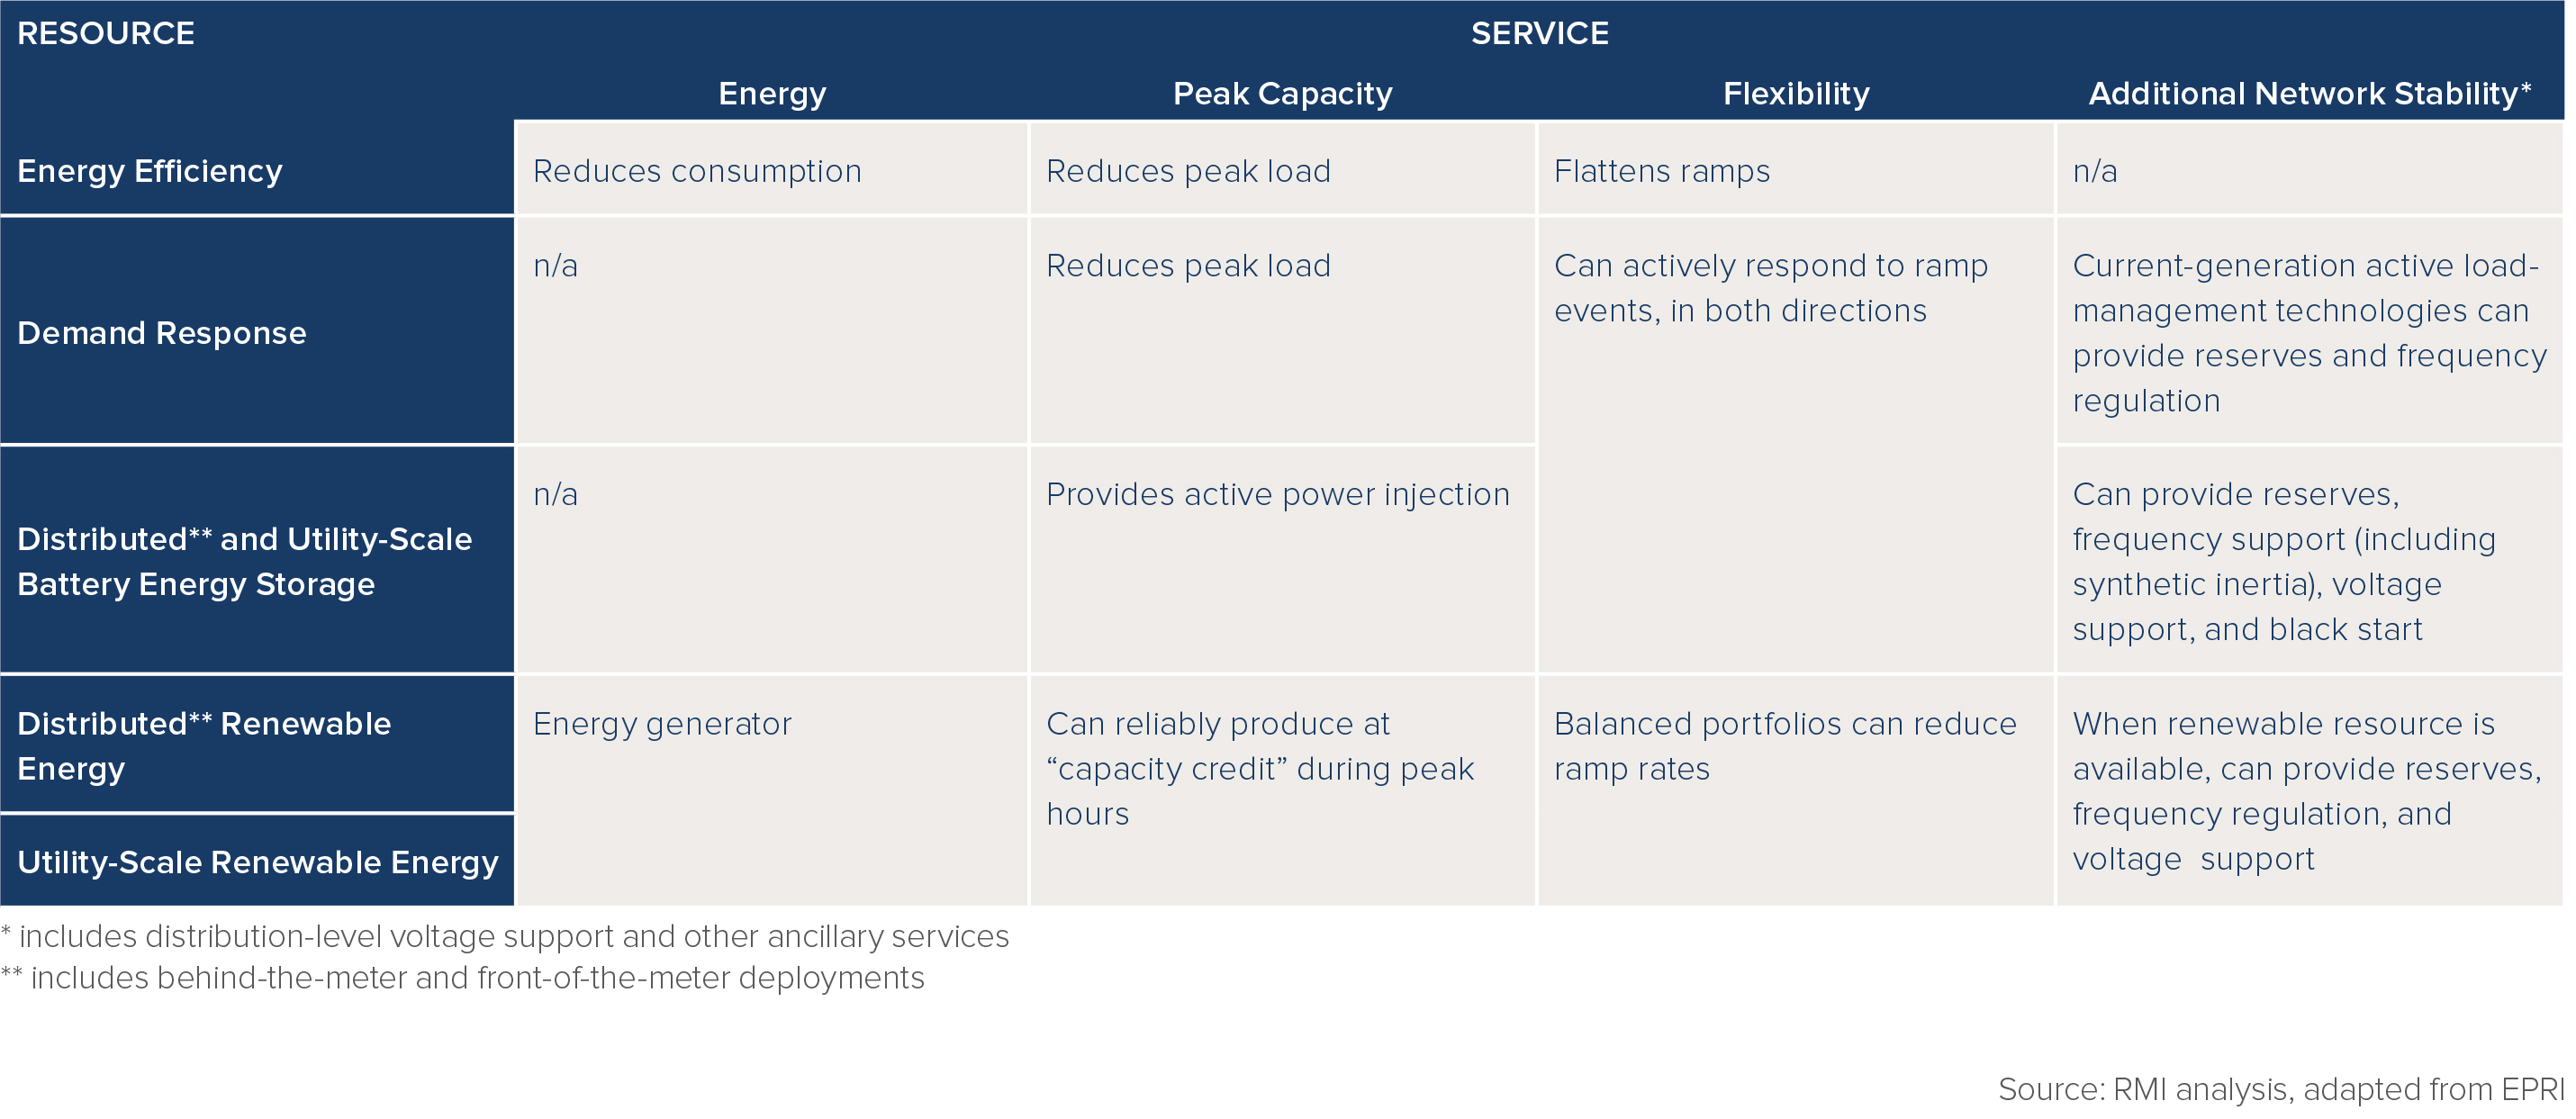
RMI examined a scenario where more than half of retiring thermal capacity through 2030 was replaced by portfolios of resources that can provide the same energy, peak capacity, and flexibility to the grid, using conservative assumptions of both renewable and DER adoption. This pathway would unlock a $350 billion market for renewables and DERs through 2030, while avoiding 3.5 billion tons of CO2 emissions over the same time period.


Related Insights


Help build the clean energy future. Donate today.
Independent research. Real-world solutions. Supported by donors.
RMI can pursue the highest-impact climate and energy solutions because we’re supported by people who believe change is possible. Every gift helps advance the work needed to make clean energy the default choice worldwide.
For other ways to give to RMI, including checks or gifts of stock, please visit Other Ways to Give.
